
employees were engaged](https://www.gallup.com/workplace/712433/employee-engagement-remains-flat-adoption-accelerates.aspx) at work in the first half of 2026, a figure unchanged from 2025, while globally just 20% of workers qualify as engaged. That gap between American and global numbers looks reassuring until you factor in the cost: low engagement drains an estimated $10 trillion from the global economy each year. For HR leaders building their 2026 strategy, the employee engagement statistics 2026 data points to two urgent priorities: reverse the sharp decline in manager engagement, and pair AI adoption with genuine manager support before cultural debt compounds.
The 2026 snapshot in one line: With only 1 in 3 U.S. employees engaged and manager engagement down roughly 9 points since 2022, the organizations that act on manager enablement and structured AI integration this quarter will widen the gap on everyone else.
Key Takeaways
| Point | Details |
|---|---|
| U.S. engagement is flat at 31% | First-half 2026 Gallup data shows no year-over-year improvement, with 18% actively disengaged. |
| Manager decline is the core risk | Manager engagement has dropped ~9 points since 2022; managers explain ~70% of team engagement variance. |
| AI needs a human layer | Engagement is higher where AI adoption includes manager support; without it, cultural debt accumulates. |
| Continuous listening outperforms annual surveys | Qualtrics research links always-on listening and analytics to stronger engagement and retention outcomes. |
| Charitymiles connects movement to engagement | The Employee Empowerment Program ties physical activity and CSR to measurable participation, as HARMAN’s 11x lift demonstrates. |
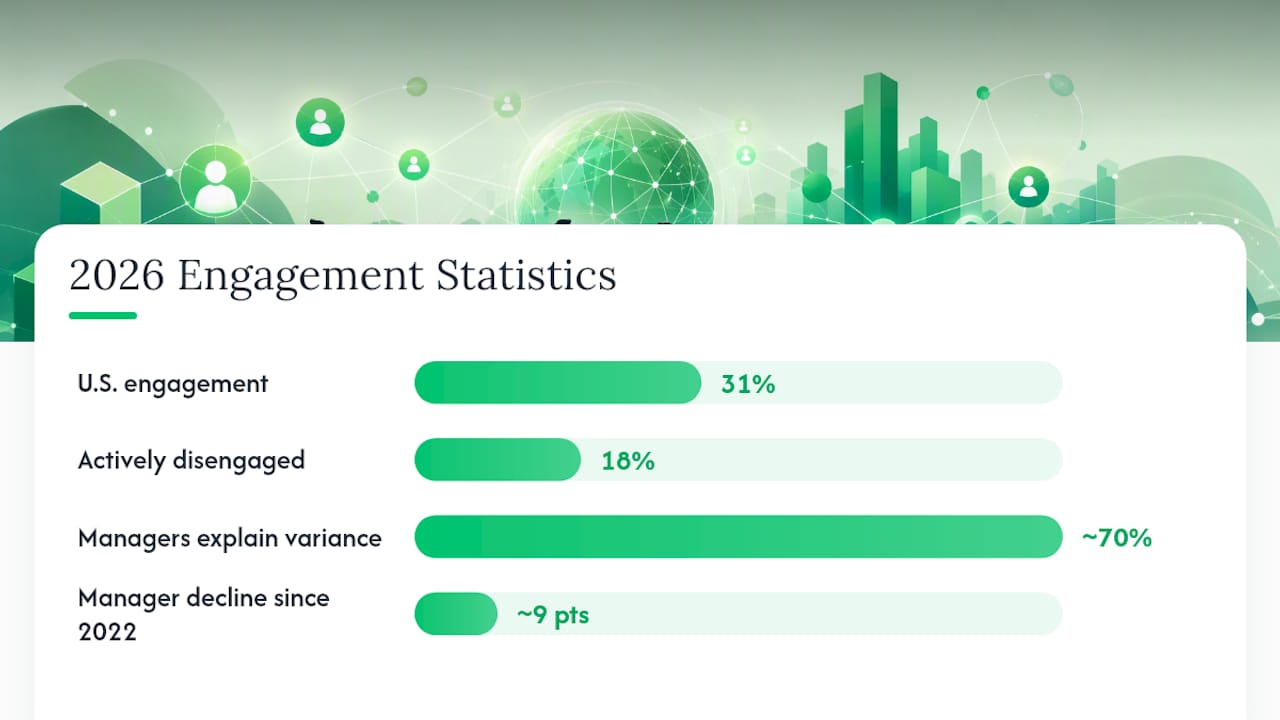
Table of Contents
- 1. The most important employee engagement statistics for 2026
- 2. What the 2026 numbers actually mean for your organization
- 3. U.S. benchmarks and how to compare your organization
- 4. What HR leaders should prioritize in 2026
- 5. How to measure engagement in 2026: design, cadence, and what to trust
- 6. How a movement-based CSR pilot can lift participation and engagement
- 7. How to read engagement statistics carefully
- 8. The manager problem is bigger than most leaders admit
- Charitymiles turns movement into measurable engagement
- Primary sources and recommended reading
- Sources
1. The most important employee engagement statistics for 2026
These 12 figures are the ones worth putting in a briefing slide. Each is sourced, scoped, and ready to use.
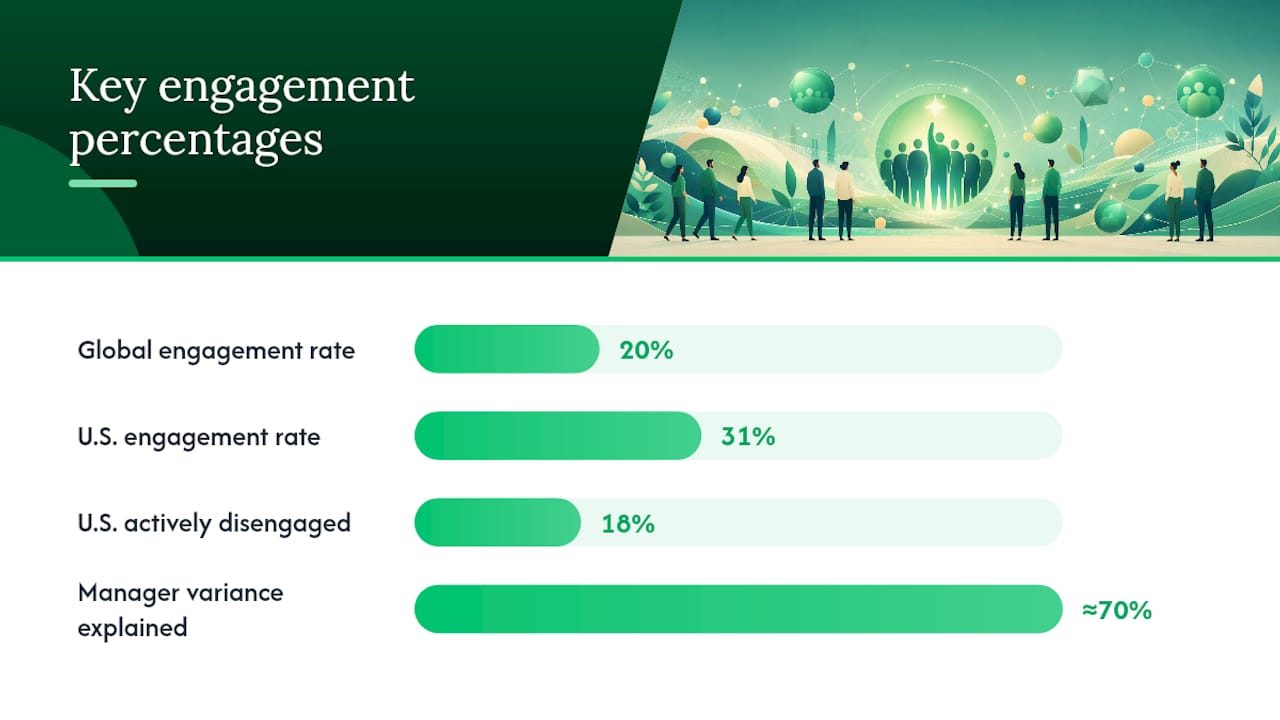
- Global engagement rate: 20%. Gallup’s 2026 data puts worldwide employee engagement at 20%, down from a peak of 23% in 2022.
- U.S. engagement rate: 31%. The first half of 2026 shows U.S. engagement holding at 31%, flat year-over-year per Gallup’s mid-year report.
- Actively disengaged U.S. workers: 18%. Nearly 1 in 5 American employees is actively working against their organization’s interests, not just coasting.
- Manager engagement decline: ~9 points since 2022. Manager engagement has fallen sharply, a structural shift with outsized downstream effects on every team they lead.
- Manager variance in team engagement: ~70%. Gallup’s strategy guidance confirms that managers explain roughly 70% of the variance in team engagement scores, making them the single highest-leverage intervention point.
- Global economic cost: ~$10 trillion annually. The estimated drag from disengaged employees worldwide, per Gallup’s synthesis reported by SpaceForms.
- AI adoption and engagement link. Organizations that adopt AI and provide manager support for AI use show higher engagement than those that deploy AI without that support layer.
- Engagement trend since 2015. Global engagement climbed from 15% in 2015 to 23% in 2022, then reversed to roughly 20% by 2026, suggesting the post-pandemic engagement lift has unwound.
- Europe lags the U.S. significantly. Regional variance is wide: European engagement rates sit well below the U.S. 31% benchmark, meaning multinationals should not apply a single global target.
- Continuous listening correlates with better outcomes. Qualtrics’ 2026 employee experience research finds that organizations using continuous listening and analytics report stronger engagement and retention results than those relying on annual surveys alone.
- Worker anxiety about AI is real. Pew Research Center reports U.S. workers are more worried than hopeful about AI’s future workplace effects, a sentiment that can suppress engagement unless leaders provide clear guidance and skill-building.
- Trust deficit compounds disengagement. Harvard Business Review reports that many employees distrust their leaders, and that trust-building alongside work design that people find meaningful remains a core driver of sustained engagement.
| Stat | Value | Source | Scope/Date |
|---|---|---|---|
| Global engagement rate | 20% | Gallup / SpaceForms | 2026, n=141,444 |
| U.S. engagement rate | 31% | Gallup | First half 2026 |
| U.S. actively disengaged | 18% | Gallup | First half 2026 |
| Manager engagement decline | ~9 points | SpaceForms synthesis | Since 2022 |
| Manager variance in team engagement | ~70% | Gallup | 2026 guidance |
| Global cost of low engagement | ~$10 trillion/year | Gallup / SpaceForms | 2026 estimate |
2. What the 2026 numbers actually mean for your organization
Manager disengagement is the multiplier problem
The 9-point drop in manager engagement since 2022 is the most structurally dangerous trend in the current data. Because managers account for roughly 70% of team engagement variance, a disengaged manager does not just underperform individually. They pull down every direct report’s score. When you see a team with flat or declining engagement, the first question is almost always about the manager’s own experience, not the team’s.
What drove the decline? Post-pandemic role expansion, increased administrative burden, and the expectation that managers absorb organizational change without adequate support. Many were promoted for technical skill and handed people-management responsibilities without the clarity, coaching, or development that would make those responsibilities sustainable.
AI adoption: a double-edged signal
Deloitte’s Human Capital Trends research introduces the concept of “cultural debt” — the accumulated gap between how fast technology changes work and how slowly human-centric behaviors, trust, and manager guidance catch up. Organizations rolling out AI tools without a parallel investment in manager enablement and employee skilling are building that debt quietly. Microsoft’s AI skilling guidance frames organizational learning programs as a critical path for reducing burnout risk alongside productivity gains.
The positive signal: where AI adoption comes with manager support and clear skill-building pathways, engagement is measurably higher. The risk is not AI itself but the gap between deployment speed and human readiness.
Remote, hybrid, and on-site patterns
Work location still shapes engagement, though the picture is more nuanced than “remote workers are disengaged.” The more consistent finding is that clarity matters more than location. Employees who understand expectations, feel connected to their team’s purpose, and receive regular feedback engage at higher rates regardless of where they sit. Hybrid arrangements that lack structured connection rituals tend to score lower, not because of the model but because of the absence of intentional design.
Structural vs. cyclical: The post-2022 global decline looks structural. It tracks with manager burnout, AI uncertainty, and cost-pressure-driven workforce changes, not a temporary dip. Plan your 2026 strategy accordingly.
3. U.S. benchmarks and how to compare your organization
The U.S. data here is how to use it.
How to map your internal score to these benchmarks:
- Align question wording first. Gallup’s engagement measure uses its Q12 instrument. If your survey uses different wording or a “fully engaged / partially engaged” scale, a direct percentage comparison will mislead. Map your top-box score to Gallup’s “engaged” definition before drawing conclusions.
- Check your sample size. A 200-person company with a 60% response rate gives you 120 data points. That is enough for a directional read but not for statistically reliable subgroup splits by department or tenure.
- Segment by manager. Because manager quality drives so much variance, an org-wide number can mask a bimodal distribution: some teams at 60%+ engaged, others at 10%. Segment before you act.
- Track trend, not just level. A company at 28% engaged but rising is in a better position than one at 35% and falling. Your internal trend line is often more useful than a single benchmark comparison.
- Note timing. Gallup’s first-half 2026 data was collected in a specific window. If your survey ran during a major organizational change, your numbers may reflect that event rather than baseline engagement.
For practical employee engagement survey questions that align with public benchmarks, you can adapt Gallup-style items on clarity, recognition, development, and belonging.
4. What HR leaders should prioritize in 2026
The data points to a clear sequence. Start with managers, build measurement infrastructure, then layer in AI governance and wellbeing programs.
30-day priorities
- Run a manager check-in pulse. A 5-question pulse focused on manager clarity, workload, and support needs takes two weeks to field and gives you the data to triage which managers need immediate attention.
- Audit your current engagement metric. Confirm what question(s) you are using, how they map to public benchmarks, and when you last fielded a full survey.
- Identify your three most disengaged teams. Use existing data, turnover signals, or absenteeism patterns. These are your pilot targets for manager enablement.
90-day priorities
- Launch a manager enablement cohort. Small-group coaching or peer learning circles focused on clarity-setting, recognition habits, and one-on-one cadence. Gallup’s three strategies for 2026 center on clarity, connection, and development — these translate directly into manager skill-building modules.
- Establish a pulse survey cadence. Quarterly pulses with a consistent core set of questions give you trend data within a year. Monthly is better for large organizations with fast-moving teams.
- Draft an AI integration guideline for managers. Address what tools are approved, how managers should discuss AI changes with their teams, and what skill-building support is available. This directly counters the cultural debt risk Deloitte identifies.
365-day priorities
- Build a wellbeing and burnout prevention program. Physical activity, mental health resources, and flexible scheduling are the three most consistently cited levers. Programs that combine movement with social purpose tend to sustain participation longer than fitness-only initiatives.
- Scale continuous listening. Move from periodic surveys to always-on sentiment channels (manager check-ins, exit/stay interviews, team retrospectives) and connect the data to your engagement dashboard.
- Report manager engagement as a standalone metric. Boards and C-suites that see manager engagement tracked separately from overall engagement make faster decisions about manager investment.
Pro Tip: The fastest way to reverse manager disengagement is a structured “skip-level” conversation program: senior leaders meet directly with frontline employees, bypassing the manager layer. This signals organizational investment in every level, relieves managers of being the sole communication conduit, and surfaces problems before they compound.
For a fuller catalog of employee engagement best practices, including program ideas HR teams can adapt by company size and industry, the Charitymiles resource library covers both tactical and strategic approaches.
5. How to measure engagement in 2026: design, cadence, and what to trust
Survey design and question alignment
The most common benchmarking mistake is comparing your internal “satisfaction” score to Gallup’s “engagement” rate. They measure different constructs. Gallup’s Q12 captures behavioral engagement: whether employees know what is expected, have the resources to do their work, feel their opinions count, and have opportunities to develop. A general satisfaction question captures something closer to mood. Before you benchmark externally, confirm your instrument measures the same construct.
Qualtrics’ 2026 trends research highlights that organizations using continuous listening tools alongside analytics are better positioned to predict disengagement before it shows up in turnover data. The shift from annual surveys to always-on listening is the most significant methodological change in the field right now.
For organizations evaluating which platform to use, a comparison of engagement survey platform alternatives can help you match tool capabilities to your measurement goals.
Cadence recommendations
- Annual survey: Minimum baseline. Useful for trend comparison year-over-year but too slow to catch emerging problems.
- Quarterly pulse (5–10 questions): The practical sweet spot for most mid-size organizations. Enough frequency to catch trends, low enough burden to maintain response rates.
- Monthly micro-pulse (2–3 questions): Appropriate for large organizations or teams going through significant change. Requires strong communication to avoid survey fatigue.
- Always-on channels: Manager check-ins, stay interviews, and team retrospectives that feed a central dashboard. These are leading indicators; survey scores are lagging.
What to report to senior leaders
| Metric | Why it matters | Benchmark |
|---|---|---|
| Overall engagement % | Headline health indicator | U.S.: 31% (Gallup, first half 2026) |
| Actively disengaged % | Risk and cost signal | U.S.: 18% (Gallup, first half 2026) |
| Manager engagement % | Multiplier metric | Track vs. prior period; flag drops |
| AI usage + manager support score | Cultural debt early warning | No public benchmark yet; track internally |
| Response rate | Data quality check | Target 70%+ for reliable trends |
6. How a movement-based CSR pilot can lift participation and engagement
The HARMAN case offers a concrete proof point for what happens when engagement strategy connects personal purpose to company mission.
What the pilot looked like:
- Goal: Increase voluntary participation in a company wellness and CSR initiative.
- Activities: Employees logged walking, running, and biking miles through the Charitymiles app. Each mile generated a charitable donation to a cause of the employee’s choice.
- Mechanism: Private company team with intra-company challenges and a friendly leaderboard.
- Outcome metrics tracked: Participation rate (employees active in the program), total miles logged, total donations generated, and qualitative engagement signals from manager check-ins.
Outcomes:
- 11x increase in employee participation vs. pre-program baseline.
- 1,200+ active employees across the program.
- $120,000+ generated for charity, creating visible, measurable social impact.
- Sustained participation over multiple years, not a one-off spike.
A replicable 8-week pilot template:
- Define a participation target (e.g., 20% of eligible employees active in week one).
- Set a charitable giving goal that is visible to all participants.
- Launch with a manager kickoff message that connects the program to company values.
- Run two intra-team challenges during the 8 weeks to sustain momentum.
- Share a mid-point progress update company-wide (miles logged, donations generated).
- Close with a summary report: participation rate, total impact, and a short pulse survey on how the program affected employees’ sense of belonging and pride.
The key driver of sustained engagement in programs like this is intrinsic motivation anchored to extrinsic recognition. Employees move because it matters to them personally; the team challenge and visible impact give them a reason to keep going.
7. How to read engagement statistics carefully
Public engagement statistics are useful, but they carry assumptions that can mislead if you apply them without checking.
Common caveats to watch for:
- Definition differences. “Engaged,” “highly engaged,” “fully engaged,” and “committed” are not interchangeable. Gallup’s engaged category is narrower than many vendor definitions. A vendor claiming 60% engagement using a broader scale is not comparable to Gallup’s 31%.
- Sample scope. Gallup’s global figure draws on a large multinational sample (n=141,444 in the SpaceForms synthesis). A regional or industry-specific study with 500 respondents will show different numbers for structural reasons, not because one is wrong.
- Timing and recency. A study fielded during a major economic disruption or a company-wide layoff period will capture a different signal than a stable-period baseline. Always check when data was collected.
- Question wording effects. Small changes in how engagement questions are phrased produce measurable differences in response distributions. “I am proud to work here” and “I would recommend this company as a great place to work” tap related but distinct constructs.
- Nonresponse bias. If your least engaged employees are also least likely to complete a survey, your results will skew positive. A 40% response rate is not a representative sample.
- Regional and industry variance. The U.S. 31% figure does not apply to a European subsidiary or a healthcare organization with high burnout rates. Always apply the most specific benchmark available.
Simple checks before using a public stat:
- Confirm the sample size and collection date.
- Identify the exact question(s) used to define “engaged.”
- Check whether the figure is global, national, or industry-specific.
- Ask whether your own organization’s survey uses comparable wording.
When your internal trend data and a public benchmark conflict, trust your trend data for decision-making. Public benchmarks set context; your internal data drives action.
8. The manager problem is bigger than most leaders admit
There is a tendency in HR circles to treat engagement as a culture-wide challenge that requires culture-wide solutions: new values statements, company-wide recognition programs, all-hands meetings. Those interventions have their place. But the data is unambiguous: managers explain roughly 70% of team engagement variance, and manager engagement itself has fallen sharply since 2022. That combination means the most expensive culture programs in the world will underperform if the managers delivering them are burned out, unclear on expectations, or feel unsupported themselves.
The harder truth is that many organizations have systematically under-invested in manager development while simultaneously expanding manager scope. Managers absorbed remote team coordination, mental health support conversations, AI change management, and performance accountability, often without additional training, reduced administrative load, or clearer role boundaries. The 9-point decline in manager engagement is not a mystery. It is a predictable outcome of that accumulation.
The fix is not a one-day leadership training. It is a sustained investment in manager clarity (what does success look like in this role?), manager connection (do they have peers to learn from?), and manager development (are they growing, not just executing?). These are the same three levers Gallup recommends for employees. Managers need them too.
Charitymiles turns movement into measurable engagement
When engagement scores are flat and wellbeing programs feel like checkbox exercises, the organizations seeing real participation lifts are the ones connecting daily activity to something employees actually care about.
Charitymiles’ Employee Empowerment Program gives HR leaders a concrete, low-friction way to address three engagement drivers at once: physical wellbeing, social purpose, and team belonging. Employees walk, run, or bike; every mile generates a donation to a charity of their choice; private team challenges create friendly competition and camaraderie. Companies control the sponsorship rate, the total cap, and the cause direction. If you want to see what a pilot could look like for your organization, explore the best employee engagement software options Charitymiles offers and request a program walkthrough today.
Primary sources and recommended reading
These are the reports that underpin the data in this article. Each serves a different purpose depending on whether you need a benchmark, a strategy framework, or measurement guidance.
-
Gallup: Employee Engagement Remains Flat as AI Adoption Accelerates — The primary U.S. benchmark source for 2026. Use this for the 31% engaged / 18% actively disengaged figures and for the AI-manager support correlation. Best for: benchmarking and briefing leadership.
-
Gallup: 3 Employee Engagement Strategies for 2026 — Gallup’s action-oriented companion to the benchmark data. Covers clarity, connection, and development as the three priority levers, and quantifies the manager variance finding. Best for: building your manager enablement program.
-
Deloitte: Human Capital Trends — The source for the “cultural debt” concept and the most thorough treatment of AI’s human-centric risks. Best for: AI governance planning and senior leadership conversations about organizational change.
-
Qualtrics: Employee Experience Trends 2026 — Covers continuous listening, AI-driven sentiment analysis, and the analytics practices correlating with better outcomes. Best for: measurement design and platform evaluation.
-
Pew Research Center: U.S. Workers and AI — Worker sentiment data on AI anxiety. Best for: framing internal communications around AI adoption and understanding the employee perspective before rolling out new tools.
-
SpaceForms: Employee Engagement Statistics 2026 — A synthesis of Gallup longitudinal data including the global 20% rate, the $10 trillion cost estimate, regional breakdowns, and the manager engagement decline trend. Best for: a single-source summary of the headline numbers.
-
Harvard Business Review: Most Employees Don’t Trust Their Leaders — HBR’s analysis of the trust deficit and its link to engagement. Best for: leadership development conversations and designing work that builds intrinsic motivation.
Sources
- Employee Engagement Remains Flat as AI Adoption Accelerates
- 3 Employee Engagement Strategies for 2026 – Gallup
- Deloitte: Human Capital Trends
- Employee Experience Trends Reframing Work in 2026 – Qualtrics
- Employee Engagement Statistics 2026 — SpaceForms Research