
Track a short set of material KPIs defined in a Metric Dictionary, and pair every input metric with an outcome measure. The core families are environmental (emissions, waste, energy), social (participation, retention, training), and governance (board diversity, supplier audits, grievance resolution). The approach that holds up under scrutiny: define each metric precisely, pick five to ten SMART KPIs tied to what’s actually material to your business, and align them to a framework like the WEF’s stakeholder capitalism metrics or ESRS/IFRS disclosure standards.
TL;DR:
- Focus on five to ten well-defined, outcome-oriented CSR metrics linked to material issues and supported by a clear framework like WEF or IFRS.
- Create a comprehensive Metric Dictionary that precisely defines each KPI’s calculation, source, owner, and limitations to ensure auditability and consistency.
- Use verified data sources such as utility meters, HR systems, and surveys, and implement rigorous data governance practices with accountability and regular validation.
- Prioritize outcome validation over output metrics by linking participation and engagement data to actual business impacts and stakeholder value.
- Leverage activity tracking tools like Charity Miles for ongoing employee participation data, especially for engagement programs that generate social-impact metrics easily integrated into reports.
Table of Contents
- Key CSR Metrics at a Glance
- How Do You Build a Metric Dictionary?
- Where Do Reliable CSR Numbers Actually Come From?
- How Do You Align KPIs With Global Reporting Standards?
- Dashboards and Reporting: Presenting KPIs So Leadership Acts
- 7 Steps to Implement CSR Metrics This Quarter
- Case Example: Measuring Employee Participation With Charity Miles
- What Should CSR Teams Prioritize Right Now?
- How Charity Miles Fits Into Your CSR Measurement Program
- Sources
Key CSR Metrics at a Glance
You don’t need fifty KPIs. You need the right handful, defined well enough that a skeptical auditor or an internal skeptic can’t poke a hole in them. Here’s a shortlist organized by the three families that show up in almost every credible CSR program.
Environmental metrics anchor most sustainability reports because they’re the easiest to verify against hard data:
- Scope 1, 2, and 3 greenhouse gas emissions, measured in metric tons of CO2 equivalent
- Energy intensity, usually expressed as energy use per unit of revenue or per square foot
- Waste diverted from landfill, as a percentage of total waste generated
Social metrics are where most CSR managers struggle, because the data lives in HR systems and survey tools rather than utility meters:
- Employee participation rate in CSR or volunteer programs
- Volunteer hours logged per employee
- Training hours per employee, with categories like compliance, skills, leadership
- Retention rate among program participants compared to others
Governance metrics round out the picture and matter enormously to institutional investors and rating agencies:
- Board diversity, measured by gender representation
- Supplier audit coverage, as a percentage of tier-one suppliers assessed
- Grievance resolution rate, tracked as percentage closed
Pro Tip: Pick outcome-oriented measures wherever you can. A “training hours delivered” metric is an input. A “post-training skill assessment score” or “promotion rate among trained employees” is an outcome, and outcomes are what actually convince a CFO the program is working.
One useful discipline: cap your active KPI list at ten. Practitioners who focus on outcomes rather than outputs consistently find that fewer, better-defined metrics survive audit scrutiny longer than sprawling dashboards nobody trusts.
How Do You Build a Metric Dictionary?
A Metric Dictionary is a single reference document that defines every KPI so precisely that two different people, in two different quarters, would calculate the exact same number. Without one, your numbers drift, your auditors ask uncomfortable questions, and your composite scores become indefensible.
Each entry in the dictionary should include:
- Label: the metric’s plain-language name
- Definition and formula: the exact calculation, not a vague description
- Unit: percentage, hours, metric tons, dollars
- Allowed values: valid ranges or categories to catch data-entry errors
- Source system: where the raw number originates (HRIS, utility billing, survey platform)
- Frequency: how often it’s collected and refreshed
- Owner: the person accountable if the number looks wrong
- Limitations: known gaps, estimation methods, or exclusions
Compare “employee engagement” as a metric, undefined, versus “percentage of employees completing the annual engagement survey who score 4 or higher on the commitment index.” The first invites argument. The second survives an audit.
This structure matters because rating agencies and auditors query the same weak points every cycle: unclear formulas, missing baselines, inconsistent units. A Metric Dictionary answers those questions before they’re asked.
Pro Tip: Link every KPI to a materiality assessment and a documented baseline value the moment you define it. A metric without a baseline can’t show progress, and a metric without a materiality link can’t justify its own existence.
Where Do Reliable CSR Numbers Actually Come From?
Every metric family draws from a different data source, and knowing the map prevents a lot of wasted effort chasing numbers from the wrong system. Emissions and energy data typically come from utility meters and fuel invoices. Workforce metrics live in your HRIS. Supplier metrics come from audit reports and vendor questionnaires. Beneficiary and stakeholder outcome data almost always comes from surveys, which is exactly where CSR data quality tends to break down.
Survey-driven metrics need real design discipline: consistent question wording across cycles, a large enough sample to be statistically meaningful, and a fixed timing window so you’re not comparing a spring survey to a fall one.
Good data governance rests on a few essentials:
- A named owner for each data source, accountable for accuracy
- A fixed collection cadence, not an ad hoc pull whenever someone remembers
- A verification step before numbers enter the dashboard
- A traceable path from raw data to reported figure
When budget is tight, spot checks on a sample of records and periodic third-party validation catch most of the errors that matter, without the cost of a full external audit.
How Do You Align KPIs With Global Reporting Standards?
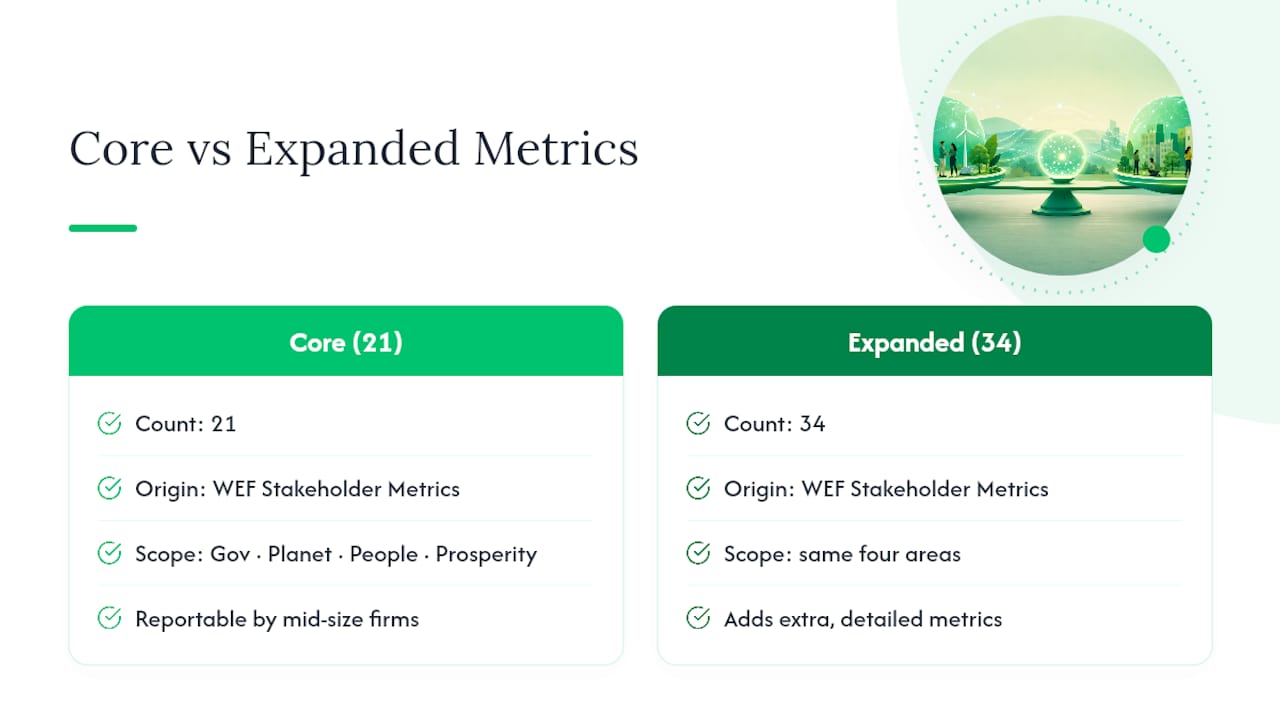
Internal KPIs mean little to outside stakeholders unless they map to a recognized framework. The World Economic Forum’s Stakeholder Capitalism Metrics define 21 core metrics and 34 expanded metrics, built specifically to give companies a common starting point instead of forcing every organization to invent its own taxonomy.
Start with the 21 core metrics. They cover governance, planet, people, and prosperity, and most mid-size companies can report on the majority of them with data they already collect. Add expanded metrics only where they reflect something genuinely material to your business.
ESRS and IFRS disclosure standards go further, requiring companies to publish not just the number but the methodology, baseline, and consistency check behind it. If your industry has no standard metric for a material issue, document your own entity-specific definition and the reasoning behind it. Reviewers accept a well-documented custom metric far more readily than an undocumented borrowed one.
Dashboards and Reporting: Presenting KPIs So Leadership Acts
A dashboard that tries to show forty metrics shows nothing. Limit the primary view to your top KPIs, and always pair the current number with a trend line and a target, not a number floating in isolation. Flag data quality issues directly on the dashboard, a low sample size or a delayed data feed, rather than hiding them in a footnote.
Structure the presentation itself using the pyramid principle: lead with the headline conclusion, then layer in supporting evidence.
Cadence should match audience. A board summary needs four to six metrics with quarterly trends. An operational dashboard for the CSR team can carry more granularity and update monthly or weekly.
On tooling: a well-structured spreadsheet works fine for a first year of five to ten KPIs. Once you’re pulling from four or more source systems, or reporting to external frameworks with audit expectations, automated dashboard tools earn their cost quickly in time saved and error reduction.
7 Steps to Implement CSR Metrics This Quarter
Moving from a vague CSR narrative to a defensible measurement program doesn’t require a year-long overhaul. It requires sequence discipline.
- Refresh your materiality assessment and shortlist the KPIs that map to your top material issues.
- Define each KPI in your Metric Dictionary, including formula, unit, and baseline value.
- Map each metric to a data source and an owner who’s accountable for accuracy.
- Pilot data collection on one or two metrics before rolling out the full set, and validate the numbers make sense.
- Build a single dashboard with trend lines, targets, and visible data-quality flags.
- Validate with internal stakeholders and link each KPI explicitly to your external disclosure framework.
- Iterate and add assurance, expanding third-party validation as the program matures and budget allows.
Following a Relevance, Rigour, and Resonance framework at each step keeps the list from ballooning back to forty metrics by next quarter.
Case Example: Measuring Employee Participation With Charity Miles
Activity-based engagement programs generate exactly the kind of participation and donation data that feeds directly into a CSR dashboard. An activity tracking program tracks miles logged, donations per mile, and participation rate by team, which converts naturally into reportable social-impact outputs.

The clearest illustration: HARMAN’s employee team, launched in 2021, saw an 11x increase in employee participation, with more than 1,200 employees generating over $120,000 for charity.
Reported well, this kind of data does more than fill a slide:
- Participation rate becomes an engagement KPI, tracked quarterly like any other
- Dollars raised becomes a community-investment KPI tied to your governance metrics
- Correlating participant retention against non-participant retention turns an output into an outcome signal
Document your assumptions when you draw that correlation. A participation spike alone doesn’t prove retention improved, but paired with a simple cohort comparison, it becomes a credible piece of a broader KPI set.
What Should CSR Teams Prioritize Right Now?
The honest trade-off nobody likes to say out loud: you can’t have comprehensive coverage and rigorous outcome validation in the same budget cycle. Pick defensible over comprehensive. A short list of well-defined, outcome-oriented KPIs beats a sprawling dashboard that collapses the first time an auditor asks how a number was calculated.
Spend this year’s budget on baselines, clean definitions, and one automated dashboard that actually works. Outcome validation studies, the kind that prove a wellness program moved retention, not just participation, come next, once the foundation holds. Mixed-method validation matters more than another quarter of new metrics nobody trusts yet.
— Gene
How Charity Miles Fits Into Your CSR Measurement Program
If your CSR dashboard needs a reliable, ongoing source of employee participation and community-investment data, Charity Miles gives you exactly that without building a new reporting system from scratch. The Employee Empowerment Program tracks miles logged, participation rates by team, and donation dollars automatically, converting everyday walks, runs, and bike rides into the kind of engagement and social-impact metrics your Metric Dictionary already has fields for.

It works particularly well for companies running ongoing engagement efforts rather than one-off events, teams that want friendly intra-company challenges, and CSR leaders who want participation numbers that update continuously instead of once a year during survey season. Pair it with your retention and wellbeing outcome studies rather than treating it as a standalone metric. If you’re evaluating platforms that can feed real engagement data into your next CSR report, see how Charity Miles compares as an employee engagement solution and check what a pilot team could look like for your company this quarter.
Sources
- Measuring Stakeholder Capitalism: Towards Common Metrics and Consistent Reporting of Sustainable Value Creation (WEF)
- PwC sustainability reporting guide — metrics (ESRS/IFRS guidance)
- A better way to measure social impact — Harvard Business Review