
The formula for employee engagement ROI is straightforward: ROI (%) = ((Net benefits − Program cost) / Program cost) × 100. What makes or breaks the calculation is the quality of your inputs, not the math itself. According to AIHR’s stepwise ROI framework, those inputs fall into five categories: productivity gains, turnover savings, absenteeism reduction, quality improvements, and customer outcome improvements.
Before you open a spreadsheet, take three steps:
- Collect baseline data from your HRIS, payroll system, and any existing engagement surveys covering the prior 12 months (voluntary turnover rate, average days absent, revenue per employee).
- Run two scenarios using the formula above: a conservative estimate (assume 25–50% of the industry benchmark uplift) and an optimistic one (assume the full benchmark). Both numbers go to leadership.
- Prepare a one-page case that shows inputs, assumptions, projected dollar benefits, program cost, ROI percentage, and a recommended pilot design.
A downloadable spreadsheet template or an online ROI calculator speeds up execution considerably. We will walk through both, plus a fully worked example, in the sections below.
Key Takeaways
Engaged employees deliver measurable financial returns across productivity, retention, and absenteeism, and the ROI formula makes those returns visible to finance: ROI (%) = ((Net benefits − Program cost) / Program cost) × 100.
| Point | Details |
|---|---|
| Start with the formula | ROI (%) = ((Net benefits − Program cost) / Program cost) × 100; apply it to conservative and optimistic scenarios. |
| Prioritize two metrics first | Voluntary turnover and absenteeism are the easiest to validate from HRIS and payroll data finance already trusts. |
| Use Gallup benchmarks as your ceiling | Gallup’s meta-analysis shows up to 23% greater profitability and 18% higher productivity in top-quartile teams; use 50% of these as your conservative input. |
| Lock assumptions before the pilot | Define formulas, cohort, and success thresholds in writing before launch to produce a defensible, auditable result. |
| Charitymiles supplies key inputs | The Employee Empowerment Program provides participation rate, program cost per employee, and team challenge data that map directly to the ROI model’s leading indicators. |
Table of Contents
- What does employee engagement ROI actually mean to finance?
- The seven metrics that convert engagement into dollars
- How to calculate engagement ROI step by step
- Which tools help you run the calculation faster?
- How to build a measurement approach leadership will trust
- What the research and real client data actually show
- How to present the ROI to leadership
- An HR leader’s perspective on what actually moves the needle
- Charitymiles gives your ROI model a measurable, ready-to-run pilot
- Sources
What does employee engagement ROI actually mean to finance?
Employee engagement ROI is not the same thing as an engagement score. An engagement score (from a pulse survey or the Gallup Q12, for example) is a signal. ROI is the financial return that signal predicts when you translate it into dollars. Finance cares about the latter, not the former.
The causal chain runs through five levers:
- Productivity: Engaged employees produce more output per hour or generate more revenue per head.
- Retention: Higher engagement reduces voluntary turnover, cutting replacement costs.
- Absenteeism: Engaged employees take fewer unplanned sick days.
- Quality: Fewer errors, less rework, and lower defect rates reduce operating costs.
- Customer outcomes: Engaged frontline employees deliver better service, which lifts CSAT and NPS scores and, ultimately, revenue.
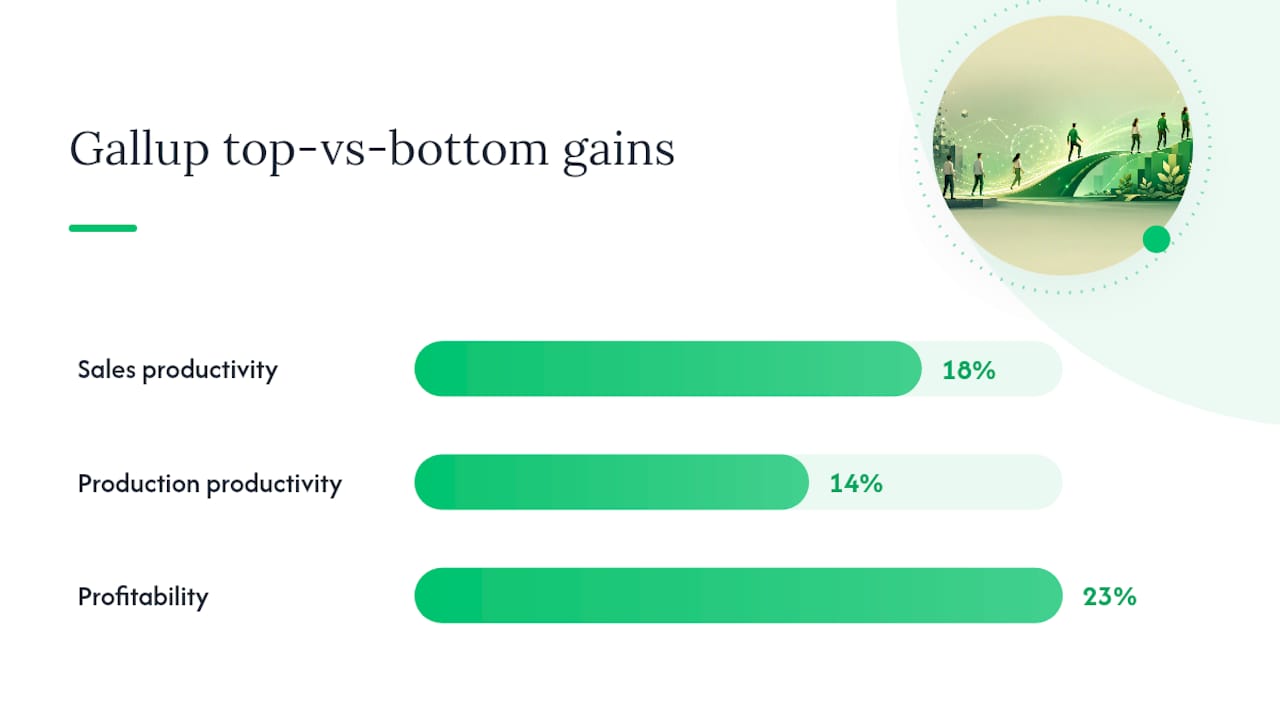
Gallup’s meta-analysis of top-quartile versus bottom-quartile work units puts concrete ranges on each lever: up to 18% higher productivity in sales roles, 14% higher in production roles, 23% greater profitability, and substantially lower absenteeism and turnover. Those are not aspirational targets; they are observed ranges across thousands of business units.
Two scope boundaries matter when you present this to a CFO. First, most productivity and retention benefits compound over 12–24 months, so a 90-day pilot will capture only a fraction of the total return. Second, some benefits (employer brand, morale, culture) are real but indirect and should be labeled as qualitative upside rather than included in the core financial model. Keeping the model conservative and transparent builds more credibility than inflating it.
The seven metrics that convert engagement into dollars
VantageCircle’s 12-metric framework groups engagement KPIs into Sentiment, Behavioral, Outcome, and Wellness categories and recommends tracking a mix of leading and lagging indicators. For an ROI model, you need the metrics that convert cleanly into dollar values. Here are the seven that matter most, in priority order.
-
Revenue per employee (productivity proxy). Formula: total revenue / average headcount. This is your primary productivity metric because it is already in financial terms. A moderate improvement in revenue per employee at a 500-person company generating substantial revenue translates to significant additional output.
-
Voluntary turnover rate and replacement cost. Formula: (number of voluntary leavers / average headcount) × 100 for the rate; multiply leavers by an estimated replacement cost per role for the dollar impact. Industry guidance consistently places replacement costs at a meaningful fraction of annual salary, though the exact figure varies by role complexity and seniority. Use your own finance team’s loaded cost estimate when possible.
-
Absenteeism days and cost per absence. Formula: (total unplanned absence days / total scheduled workdays) × 100 for the rate; multiply absence days by daily salary cost for the dollar figure. Even a one-day reduction per employee per year across a 500-person workforce adds up quickly.
-
Quality and defect rate. Track error rates, rework hours, or customer complaint volume. Convert rework hours to dollars using average hourly labor cost. This metric is most relevant in manufacturing, customer service, and software development contexts.
-
Customer satisfaction (CSAT or NPS) linked to revenue. Correlate engagement scores with CSAT trends over the same period. If your CRM tracks revenue by account and your service teams show rising NPS alongside rising engagement, you have a defensible revenue-attribution signal.
-
Internal mobility and promotion velocity. Track the percentage of open roles filled internally. Higher internal mobility reduces external hiring costs and signals that engagement is building capability, not just morale.
-
Recognition and participation rates (leading indicators). These are your early-warning metrics. VantageCircle recommends tracking eNPS, voluntary turnover, and recognition rate as a starting baseline because they move before outcome metrics do. Weekly or monthly tracking of participation in engagement programs tells you whether the intervention is landing before you wait a full quarter for turnover data.
Measurement cadence: track leading indicators (recognition rate, program participation) weekly to monthly; sentiment metrics (eNPS, pulse survey scores) monthly; outcome KPIs (turnover, productivity, absenteeism) quarterly. Workday’s guidance on finance-friendly KPIs reinforces this layered approach: engagement metrics only become strategic when they are expressed in financial terms leadership already monitors.
Pro Tip: *When presenting inputs to finance, attach a confidence range to each metric rather than a single point estimate.
How to calculate engagement ROI step by step
Required inputs
Gather these seven data points before building the model:
The formula sequence
AIHR’s ROI methodology and eLearning Industry’s calculator approach both recommend aggregating benefit streams before subtracting costs. Follow these steps:
-
Calculate turnover savings. Multiply leavers (headcount × turnover rate) by your estimated replacement cost per employee. At an 18% turnover rate across 500 employees, turnover reduction savings can be calculated using your organization’s replacement cost estimates.
-
Calculate absenteeism savings. Multiply the reduction in absence days by daily salary cost. Daily cost is calculated based on fully loaded annual salary divided by scheduled workdays, per your data… If engagement reduces absence by 1 day per employee across 500 employees, that is 500 days × $300 = $150,000 saved.
-
Calculate productivity gain. Apply the uplift percentage to revenue per employee. A conservative 3% productivity gain on $100,000 revenue per employee × 500 employees = $1,500,000 in additional output.
-
Sum all benefits. $562,500 + $150,000 + $1,500,000 = $2,212,500 in total annual benefits.
-
Apply the ROI formula. Net benefits = $2,212,500 − $150,000 (program cost) = $2,062,500. ROI = ($2,062,500 / $150,000) × 100 = 1,375%.
-
Calculate payback period. $150,000 program cost / ($2,212,500 / 12 months) ≈ 0.8 months to recover the investment.
Conservative vs. optimistic scenarios
Present both to leadership. The conservative scenario is your floor; the optimistic scenario shows the ceiling if the program performs at industry benchmark levels.
Execution steps for your spreadsheet
- Create one tab for inputs (headcount, salary, rates) and one tab for calculations.
- Lock the formula cells so inputs are the only editable fields.
- Validate turnover and absence figures against your HRIS before presenting.
- Have finance confirm the replacement cost assumption in writing.
- Add a multi-year tab that applies a 10% discount rate to years 2 and 3 of projected benefits, since engagement gains often compound but should be discounted conservatively.
Which tools help you run the calculation faster?
The fastest path to a defensible model is a pre-built spreadsheet template with locked formulas and labeled input cells. You can build one in Google Sheets or Microsoft Excel using the input table and formula sequence above. Several HR analytics platforms also offer browser-based ROI calculators that walk you through the same inputs.
Key data sources to connect to your model:
- HRIS (Workday, ADP, BambooHR): headcount, turnover events, absence records, and payroll data.
- Pulse survey platforms: engagement scores, eNPS, and participation rates exported as CSV.
- CRM (Salesforce, HubSpot): revenue per account or per sales rep for customer-outcome attribution.
- Finance system: loaded salary costs, replacement cost estimates, and program budget actuals.
ADP’s guidance on measuring employee engagement notes that HR leaders are moving from qualitative pulse checks to quantitative, finance-aligned measurement precisely because HRIS and payroll integrations now make it practical to pull these numbers without manual data entry.
How Charitymiles plugs into the model
Charitymiles’ Employee Empowerment Program supplies several inputs the ROI model needs directly. The platform tracks participation rate (the percentage of employees actively logging miles), team challenge completion, and charitable dollars generated per employee. Program cost per user is configurable: companies set their own sponsorship rate per mile and total cap, so the annual program cost input is known before the pilot launches.
For integration, export Charitymiles participation data monthly and map it to your HRIS headcount file. Participation rate serves as a leading indicator of engagement uplift.
How to build a measurement approach leadership will trust
Defensible ROI estimates require a measurement structure that finance can audit. ADP highlights that the shift toward finance-aligned engagement measurement depends on data integrity, not just data volume. Here is the checklist we recommend.
Before the pilot launches:
- Establish a 12-month pre-program baseline for all seven metrics listed above.
- Define your measurement cohort (the group receiving the program) and, where possible, a matched control group that does not.
- Lock your formulas and assumptions in writing before the pilot begins. Changing the model after you see results destroys credibility.
- Get finance sign-off on the replacement cost assumption and the productivity conversion method.
During the pilot:
- Track leading indicators (participation rate, recognition events) weekly.
- Run a monthly pulse survey or eNPS check to capture sentiment movement.
- Flag any confounding events (layoffs, restructuring, market shifts) that could explain metric changes independently of the program.
After the pilot:
- Compare cohort metrics to the control group using a difference-in-differences approach: measure the change in the cohort minus the change in the control group. This isolates the program’s effect from broader organizational trends.
- If a control group is not feasible, use a time-series baseline: compare the cohort’s post-program metrics to their own 12-month pre-program average.
- Report results with confidence ranges, not point estimates. “Turnover fell by 2–4 percentage points in the pilot cohort” is more credible than “turnover fell by 3 points.”
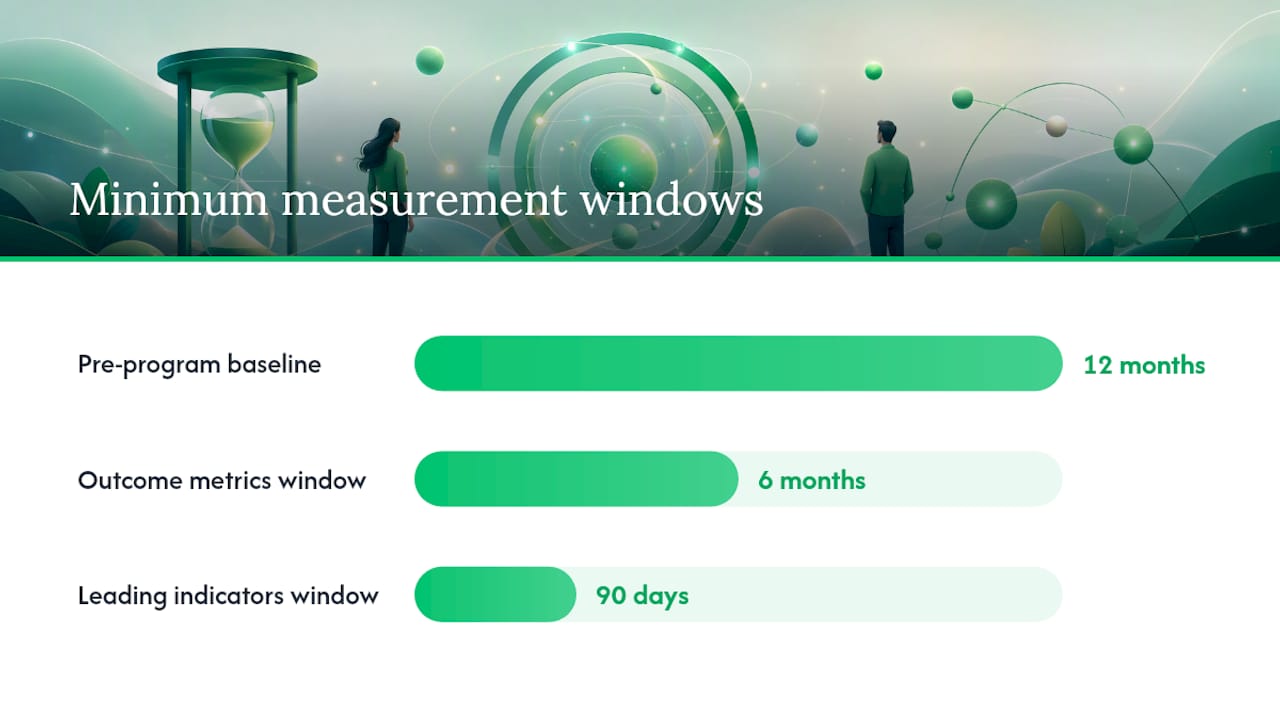
Minimum viable pilot parameters: a cohort of at least 50 employees, a measurement window of at least 90 days for leading indicators and 6 months for outcome metrics, and at least two lagging indicators (turnover, absenteeism) alongside two leading indicators (participation rate, eNPS).
If the model shows a $1,500,000 productivity gain, present $750,000 as the program-attributable portion. This conservative framing preempts the CFO’s “how do you know it was the program?” objection before it is raised.*
What the research and real client data actually show
The Gallup meta-analysis is the most cited body of evidence in this space, and for good reason. Gallup’s synthesis of top-quartile versus bottom-quartile business units shows up to 18% higher productivity in sales, 14% higher in production, 23% greater profitability, and substantially lower absenteeism and turnover. These are not projections; they are observed outcomes across thousands of teams.
Gallup data indicates substantially lower absenteeism in highly engaged teams compared to disengaged ones, with turnover differences varying depending on context. Those ranges give you the ceiling for your optimistic scenario and the basis for your conservative one.
Beyond Gallup, a few practical benchmarks from industry sources:
- Productivity uplift from engagement programs: 3–18% depending on role type and program intensity.
- Absenteeism reduction: 1–3 days per employee per year in well-run programs.
- Voluntary turnover reduction: 2–5 percentage points in the first year of a structured engagement initiative.
The HARMAN example with Charitymiles. Since launching its Charitymiles team in 2021, HARMAN saw an 11x increase in employee participation, with 1,200+ employees generating over $120,000 for charity. Map that to the ROI model: participation rate (the leading indicator) surged, which signals the engagement uplift assumption is well-supported. Program cost per employee is the sponsorship spend divided by 1,200+ participants. The charitable impact ($120,000+) is a measurable CSR output that strengthens employer brand and recruiting, both of which reduce future hiring costs.
A note on applying industry ranges to your organization. Gallup’s figures come from a global dataset spanning industries and company sizes. Your organization’s baseline engagement level, industry, and role mix will determine where in those ranges you land. If results exceed that threshold, you have evidence to apply a higher multiplier in year two.
How to present the ROI to leadership
A one-page business case is more persuasive than a 20-slide deck. Here is the structure that works:
- Objective: one sentence stating what the program aims to improve (e.g., “Reduce voluntary turnover by 3 percentage points and improve productivity by 5% over 12 months”).
- Baseline metrics: current turnover rate, absenteeism rate, revenue per employee, and engagement score.
- Projected benefits in dollars: turnover savings, absenteeism savings, and productivity gain, each with its formula and assumption stated.
- Program cost: total annual spend, broken down by per-employee cost and any fixed platform fees.
- ROI % and payback period: the two numbers executives remember.
- Recommended pilot design: cohort size, duration, KPIs, and success thresholds for scaling.
Sensitivity to assumptions
Even at the lower bound of both assumptions, the model shows a positive return. That is the point of the sensitivity table: it demonstrates that the investment is not dependent on a single optimistic assumption holding true.
Common objections and how to address them:
- “The data quality isn’t good enough.” Response: present the baseline data you have, note its source (HRIS, payroll), and propose the pilot as the mechanism for generating higher-quality data going forward.
- “We won’t see results quickly enough.” Response: show the leading indicator dashboard (participation rate, eNPS) that will produce signals within 30–60 days, well before the 6-month outcome window.
- “How do we know the program caused the improvement?” Response: describe the difference-in-differences methodology and the matched control cohort. If a control group is not feasible, explain the time-series baseline approach.
Reporting cadence: share a monthly leading-indicator dashboard with managers (participation rate, recognition events, eNPS trend) and a quarterly outcome report with the executive team (turnover, absenteeism, revenue per employee vs. baseline). The CEO/CFO view should show three numbers: ROI to date, projected full-year ROI, and program cost to date.
An HR leader’s perspective on what actually moves the needle
The ROI model is only as good as the organizational conditions around it. Running an engagement pilot without executive sponsorship is the single most common reason pilots produce weak results. When a senior leader visibly participates, participation rates in the program cohort tend to be meaningfully higher, which directly improves the leading-indicator signal you are trying to capture.
Data integrity matters more than data volume. One clean, validated metric (voluntary turnover from your HRIS) is worth more in a CFO conversation than five metrics pulled from inconsistent sources. Start your first pilot with one or two high-confidence metrics rather than trying to track all seven at once. Turnover and absenteeism are the easiest to validate because they come from payroll and HRIS systems that finance already trusts.
The other thing that gets underestimated: manager coaching. Employees engage with programs their managers actively support. If you launch a wellness or purpose-driven challenge and managers treat it as optional noise, participation drops and your leading indicators stall. Build manager activation into the pilot design from day one, and measure manager participation rate as a separate input. Aligning program objectives with measurable business outcomes from the start, rather than retrofitting the measurement after launch, is what separates a credible business case from a feel-good report.
Charitymiles gives your ROI model a measurable, ready-to-run pilot
Most engagement programs ask HR to build measurement infrastructure from scratch. Charitymiles is different: the Employee Empowerment Program comes with participation tracking, team challenge reporting, and configurable sponsorship costs built in, so the inputs your ROI model needs are available from day one.

Here is how the mapping works in practice. Set your sponsorship rate per mile and your total cap before launch: that is your program cost input, known in advance. Export monthly participation data to track your leading indicator.
For a pilot, we recommend starting with a cohort of 100–300 employees over 90 days, tracking participation rate and eNPS as leading indicators and voluntary turnover as your primary lagging metric. You can explore CSR-driven engagement strategies that complement the program, or go straight to the employee engagement solution page to discuss a pilot for your organization.
Sources
- Measuring ROI of Employee Engagement: A Practical Guide – AIHR
- Employee Engagement ROI: A Practical Guide – eLearning Industry
- Employee Engagement KPIs: 12-Metric Framework HR Uses in 2026